
Table of Contents

Importance of Urobilinogen Measurement in Urinalysis
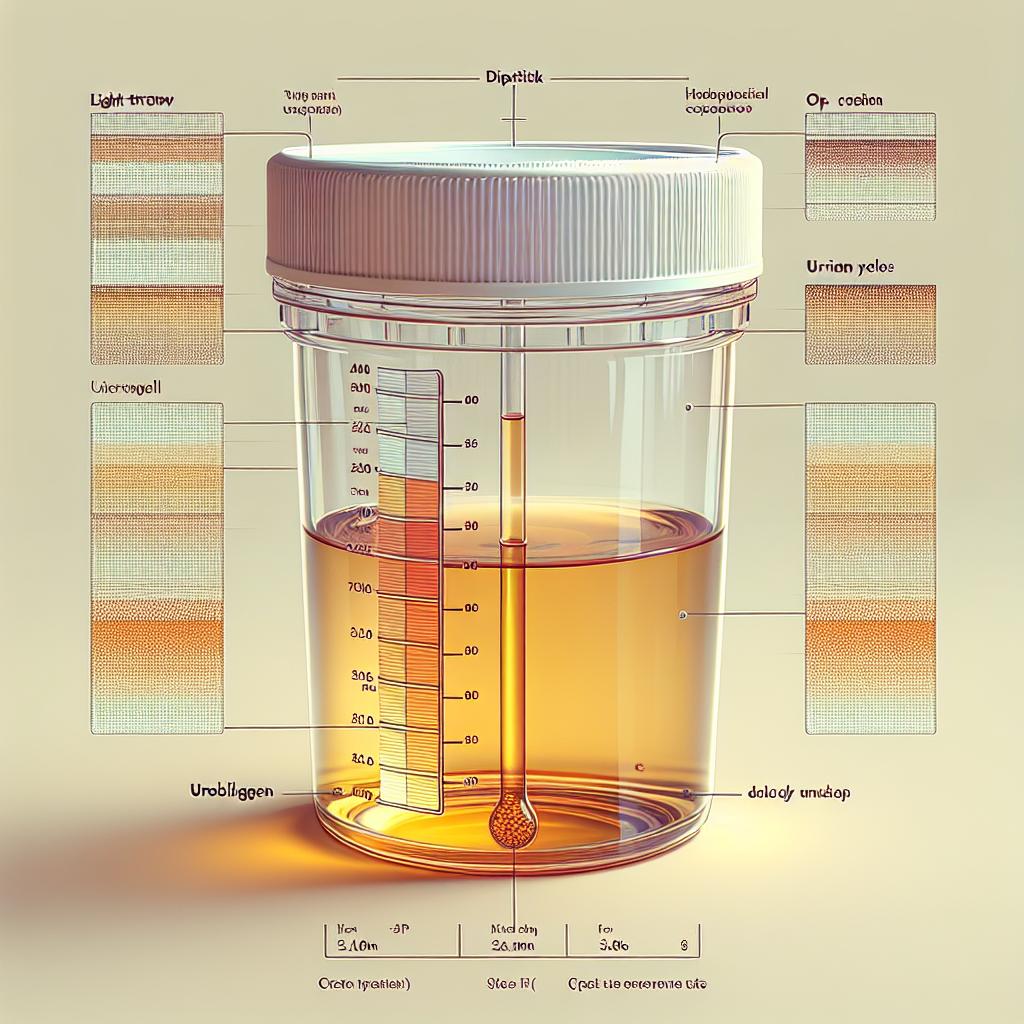
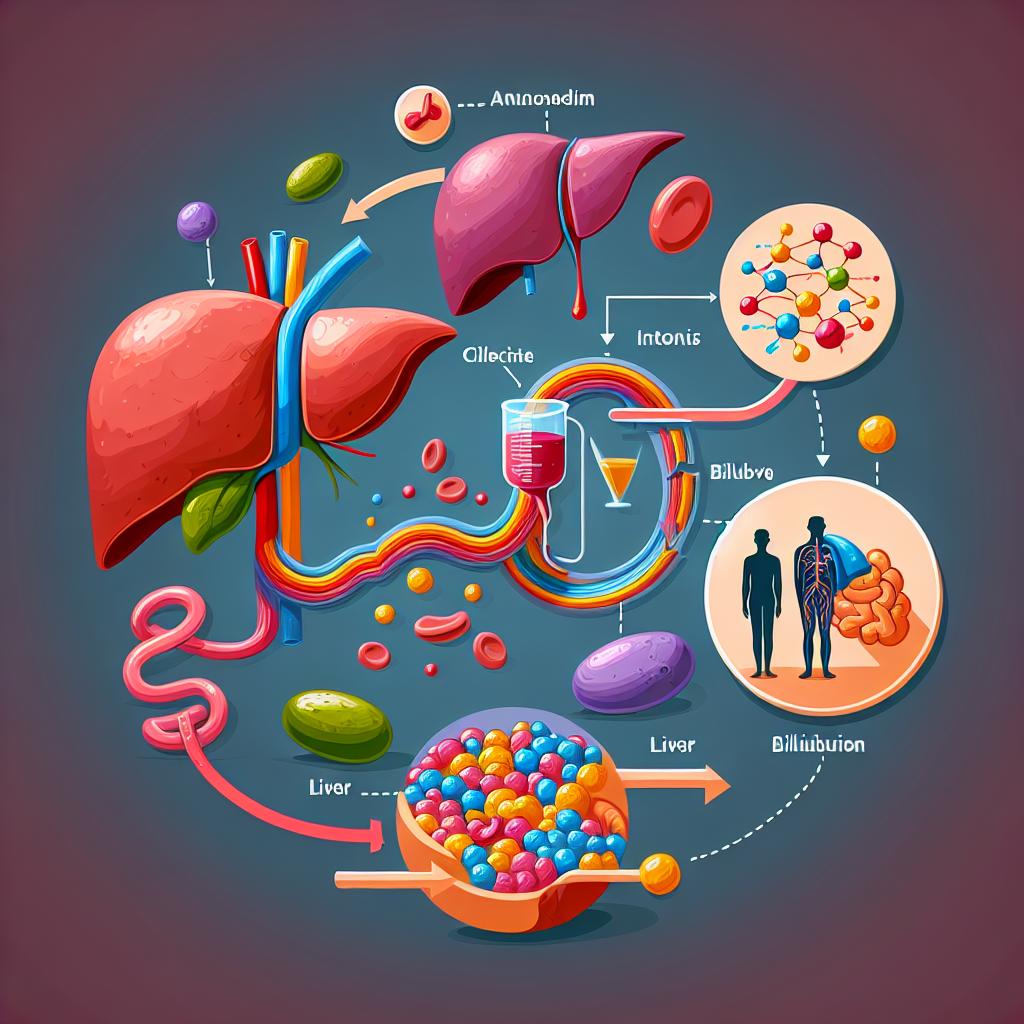
Urobilinogen is a colorless byproduct of bilirubin reduction, predominantly produced in the intestines after bilirubin is excreted into the bile and then subsequently reabsorbed. The measurement of urobilinogen levels in urine is an integral component of urinalysis, often used to assess liver function and hemolytic disorders. Elevated or decreased levels of urobilinogen can indicate various pathological conditions, including liver disease, hemolysis, and gastrointestinal issues. In clinical practice, understanding the significance of these levels can provide critical insights into a patient’s health status.
Regular monitoring of urobilinogen levels can aid in the diagnosis of liver conditions such as hepatitis or cirrhosis, where urobilinogen levels may be altered due to impaired hepatic function. Decreased levels can also be indicative of obstructive jaundice, where the flow of bile is impeded. Therefore, the assessment of urobilinogen is crucial in the early detection and management of liver diseases (Parikh et al., 2024).
Normal Ranges for Urobilinogen in Urine: What 0.2 Means
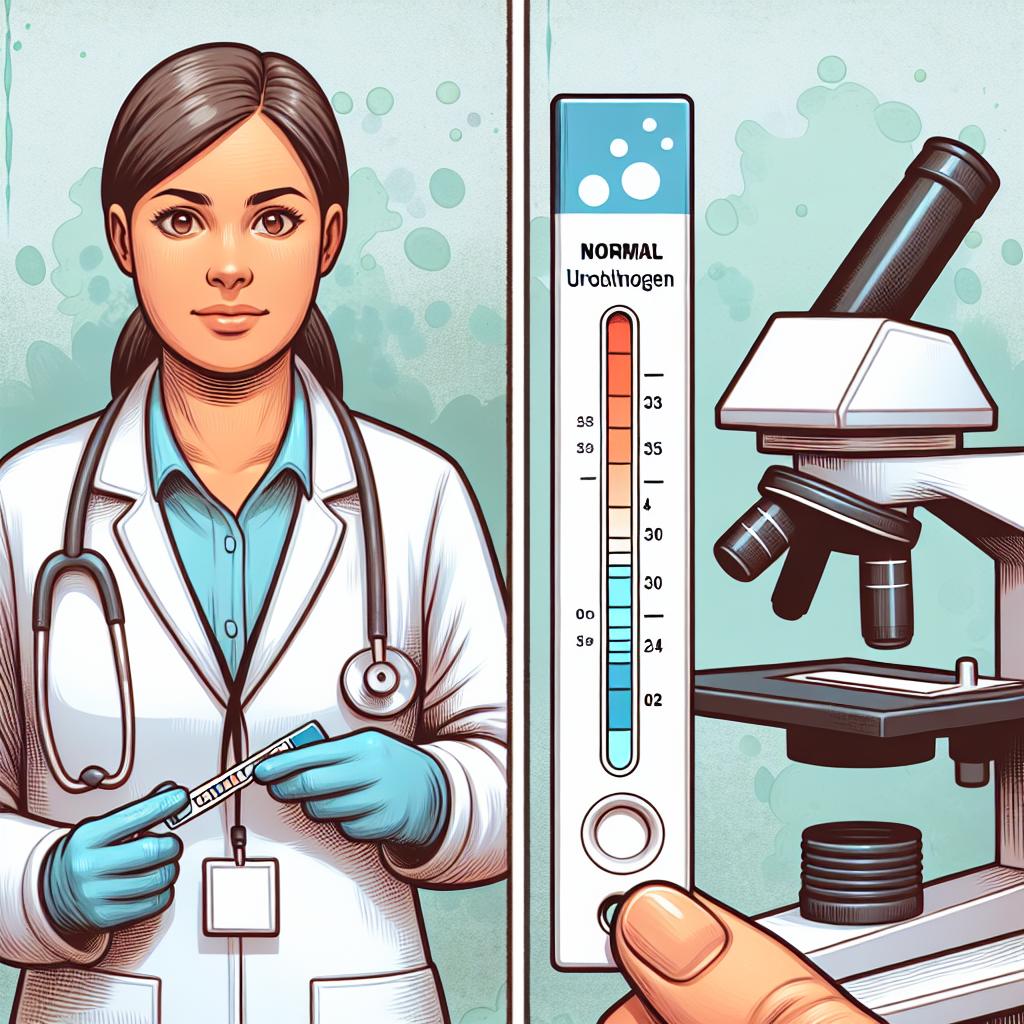
In a healthy individual, normal urine urobilinogen levels typically range between 0.1 and 1.0 mg/dL. A measurement of 0.2 mg/dL falls within this normal range, suggesting adequate hepatic function and normal bilirubin metabolism. However, understanding what this measurement entails requires deeper insight.
Urobilinogen levels of 0.2 mg/dL indicate that the liver is functioning well enough to convert bilirubin into urobilinogen, which is then filtered by the kidneys and excreted in urine. This value also suggests that there is no significant hemolysis or obstruction affecting bilirubin metabolism. Monitoring urobilinogen levels can provide a non-invasive method to gauge liver function and diagnose potential hepatic disorders early on (Parikh et al., 2024).
Clinical Implications of Elevated Urobilinogen Levels
Elevated urobilinogen levels in urine can signify underlying health issues, most commonly related to liver dysfunction or hemolytic disorders. When levels exceed the normal range, it may indicate conditions such as:

- Liver Disease: Conditions such as hepatitis or cirrhosis can lead to increased production of urobilinogen as the liver struggles to metabolize bilirubin effectively.
- Hemolytic Anemia: Increased breakdown of red blood cells leads to excessive bilirubin production, which in turn raises urobilinogen levels.
- Intestinal Obstruction: Any obstruction in the intestines can interfere with the normal metabolism of bilirubin, leading to abnormal urobilinogen levels.
Clinicians often consider elevated urobilinogen levels alongside other laboratory findings and clinical symptoms to form a comprehensive picture of a patient’s health status. For instance, elevated levels may be coupled with jaundice or altered liver function tests, prompting further investigation into potential liver pathology (Parikh et al., 2024).
Factors Influencing Urobilinogen Levels in Urine
Several factors can influence urobilinogen levels in urine, affecting both the production and excretion processes. Key factors include:
- Liver Function: The liver’s ability to process bilirubin directly impacts urobilinogen levels. Conditions that impair hepatic function will often lead to altered levels.
- Diet: High protein diets can increase urobilinogen production due to increased bilirubin formation from heme breakdown.
- Medications: Certain medications that affect liver function or bile production can also modify urobilinogen levels.
- Dehydration: Concentrated urine may lead to falsely elevated levels of urobilinogen due to reduced urine volume.
Understanding these influences is critical for healthcare providers when interpreting urinalysis results, as they can provide context for abnormal findings and guide further diagnostic testing (Parikh et al., 2024).
Diagnostic Approaches for Abnormal Urobilinogen Findings
When abnormal urobilinogen levels are detected, a thorough diagnostic approach is necessary. This may include:
- Detailed Patient History: Assessing for symptoms of liver disease, hemolysis, or gastrointestinal issues.
- Comprehensive Panel of Liver Function Tests: Including ALT, AST, alkaline phosphatase, and bilirubin levels to evaluate liver health.
- Imaging Studies: Ultrasound or CT scans of the liver can help visualize structural abnormalities or obstructions.
- Follow-Up Urinalysis: Repeat tests may be necessary to confirm initial findings and assess for trends over time.
By utilizing these diagnostic tools, healthcare providers can establish a more accurate diagnosis and appropriate management plan based on the underlying cause of abnormal urobilinogen levels.
Frequently Asked Questions (FAQs)
What does a urobilinogen level of 0.2 mg/dL indicate?
A urobilinogen level of 0.2 mg/dL is considered within the normal range, suggesting that bilirubin metabolism is functioning adequately without significant liver dysfunction.
How can elevated urobilinogen levels be treated?
The treatment for elevated urobilinogen levels depends on the underlying cause. If linked to liver disease, managing the liver condition is crucial. In cases of hemolytic anemia, addressing the cause of the hemolysis is essential.
Can diet affect urobilinogen levels?
Yes, dietary habits, particularly protein intake, can influence urobilinogen production due to variations in bilirubin metabolism.
What are the symptoms associated with abnormal urobilinogen levels?
Symptoms may vary based on the underlying condition but can include jaundice, abdominal pain, fatigue, and changes in urine color.
How often should urobilinogen levels be tested?
The frequency of testing urobilinogen levels should be determined by a healthcare provider based on individual health status and any underlying conditions.
References
- Parikh, P. C., Souza, S. D., & Obeid, W. (2024). Changes in the composition of urine over six hours using urine dipstick analysis and automated microscopy. BMC Nephrology, 24(1). https://doi.org/10.1186/s12882-024-03933-z
- Cochrane Database of Systematic Reviews. (2025). Electronic cigarettes for smoking cessation. Cochrane Database Syst Rev, 2025(1)
- Comprehensive Sepsis Risk Prediction in Leukemia Using a Random Forest Model and Restricted Cubic Spline Analysis. (2025). Journal of Infection and Public Health. https://doi.org/10.2147/JIR.S505813
- Right retrocaval ureter type 2 with left atrophied kidney: A rare case report. (2025). Cureus. https://doi.org/10.1016/j.eucr.2025.102936
- Bilateral Multivalvular Infective Endocarditis Presenting as a Splenic Infarction and Acute Ischemic Stroke in a Young Immunocompetent Woman. (2025). Cureus. https://doi.org/10.7759/cureus.77942


